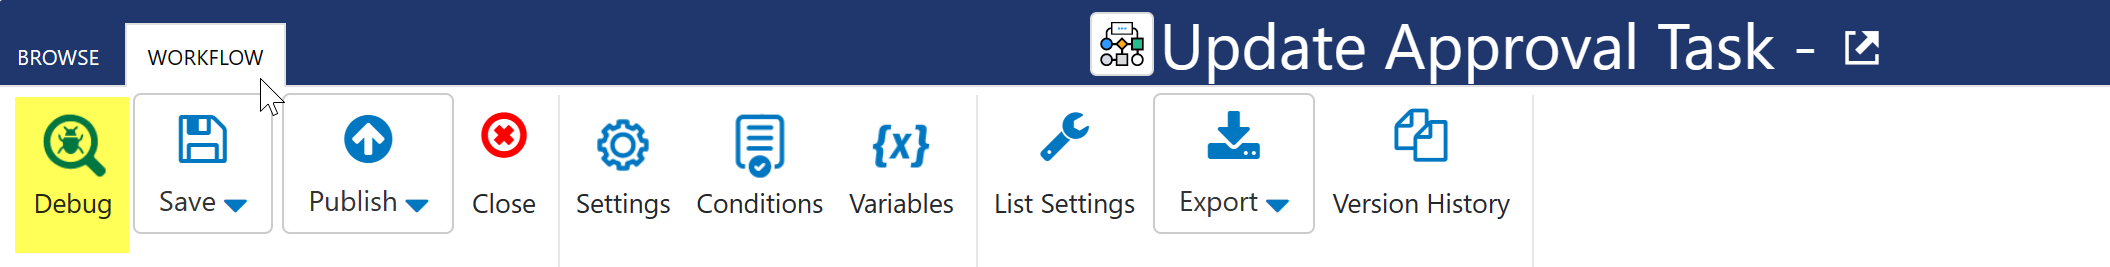
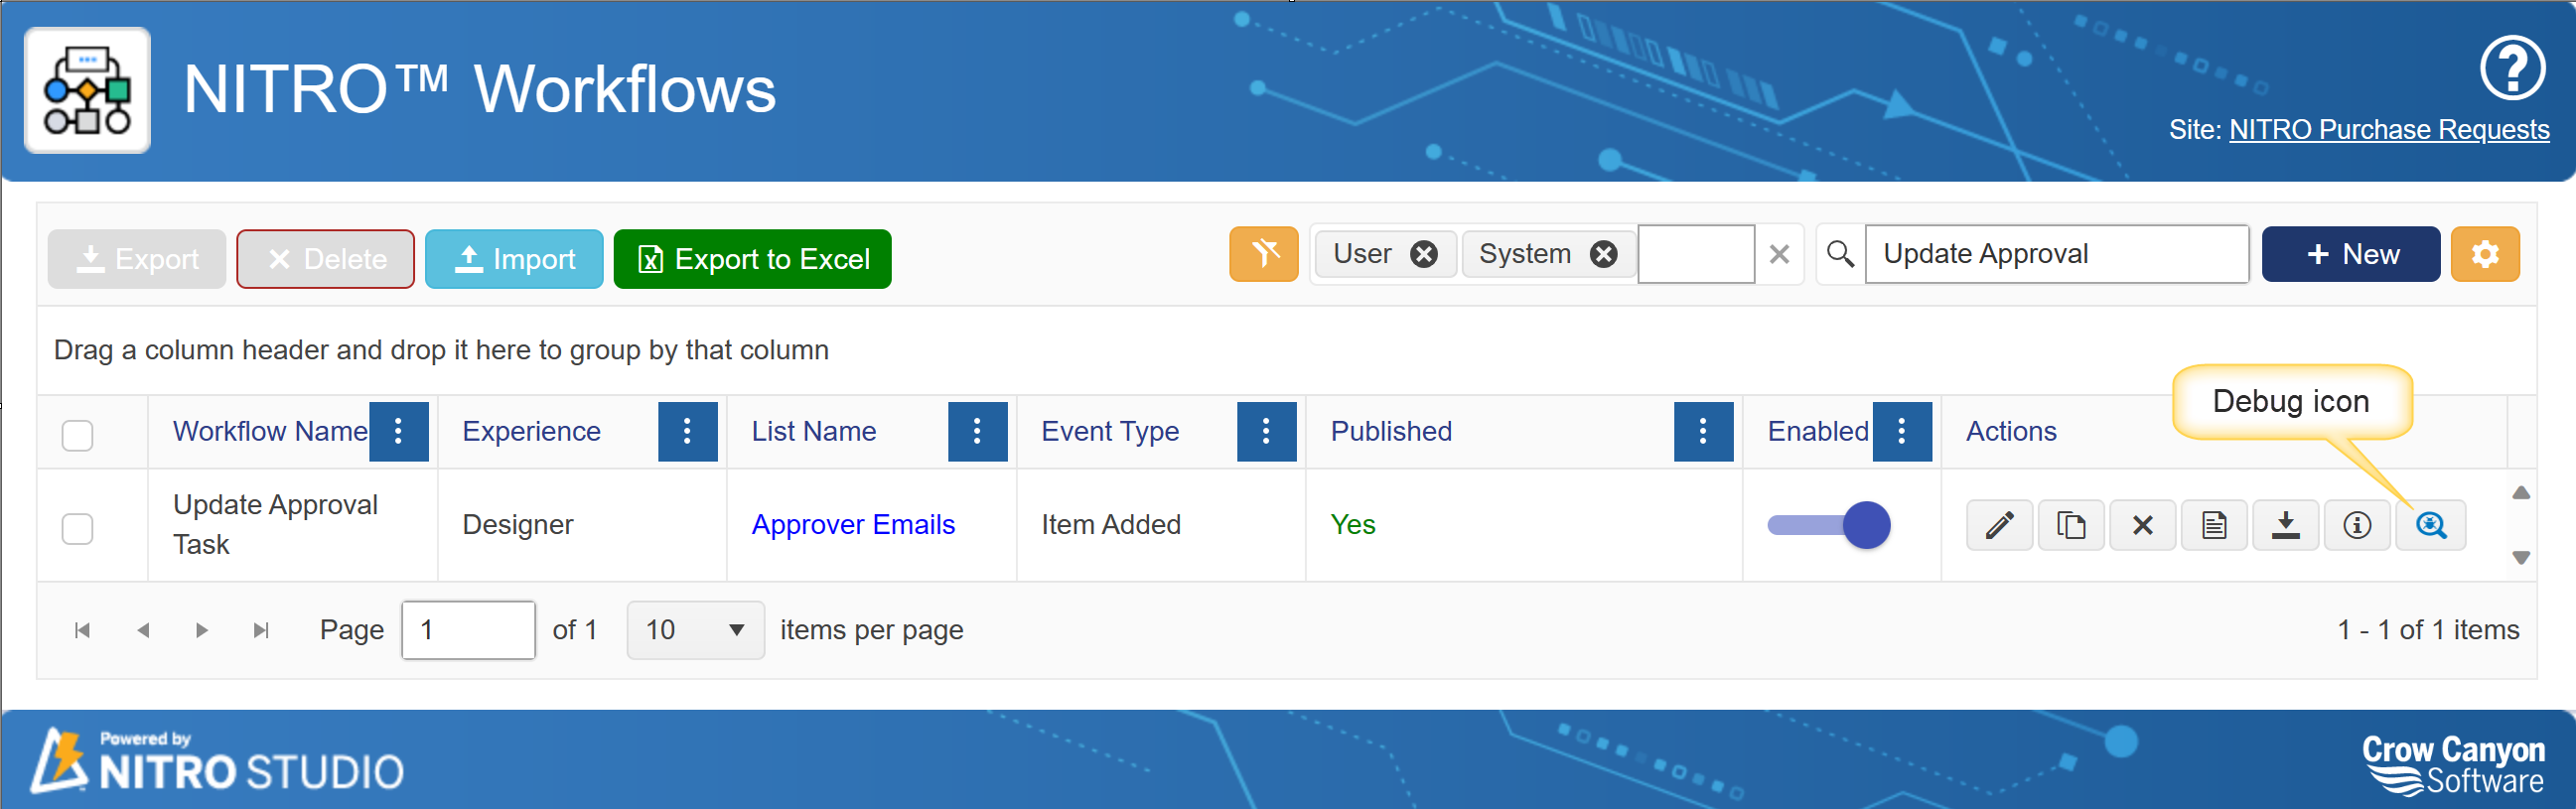
The Debug option can be accessed from either the Workflow Debug Icon (shown below), or from the list of Workflows (also shown below).
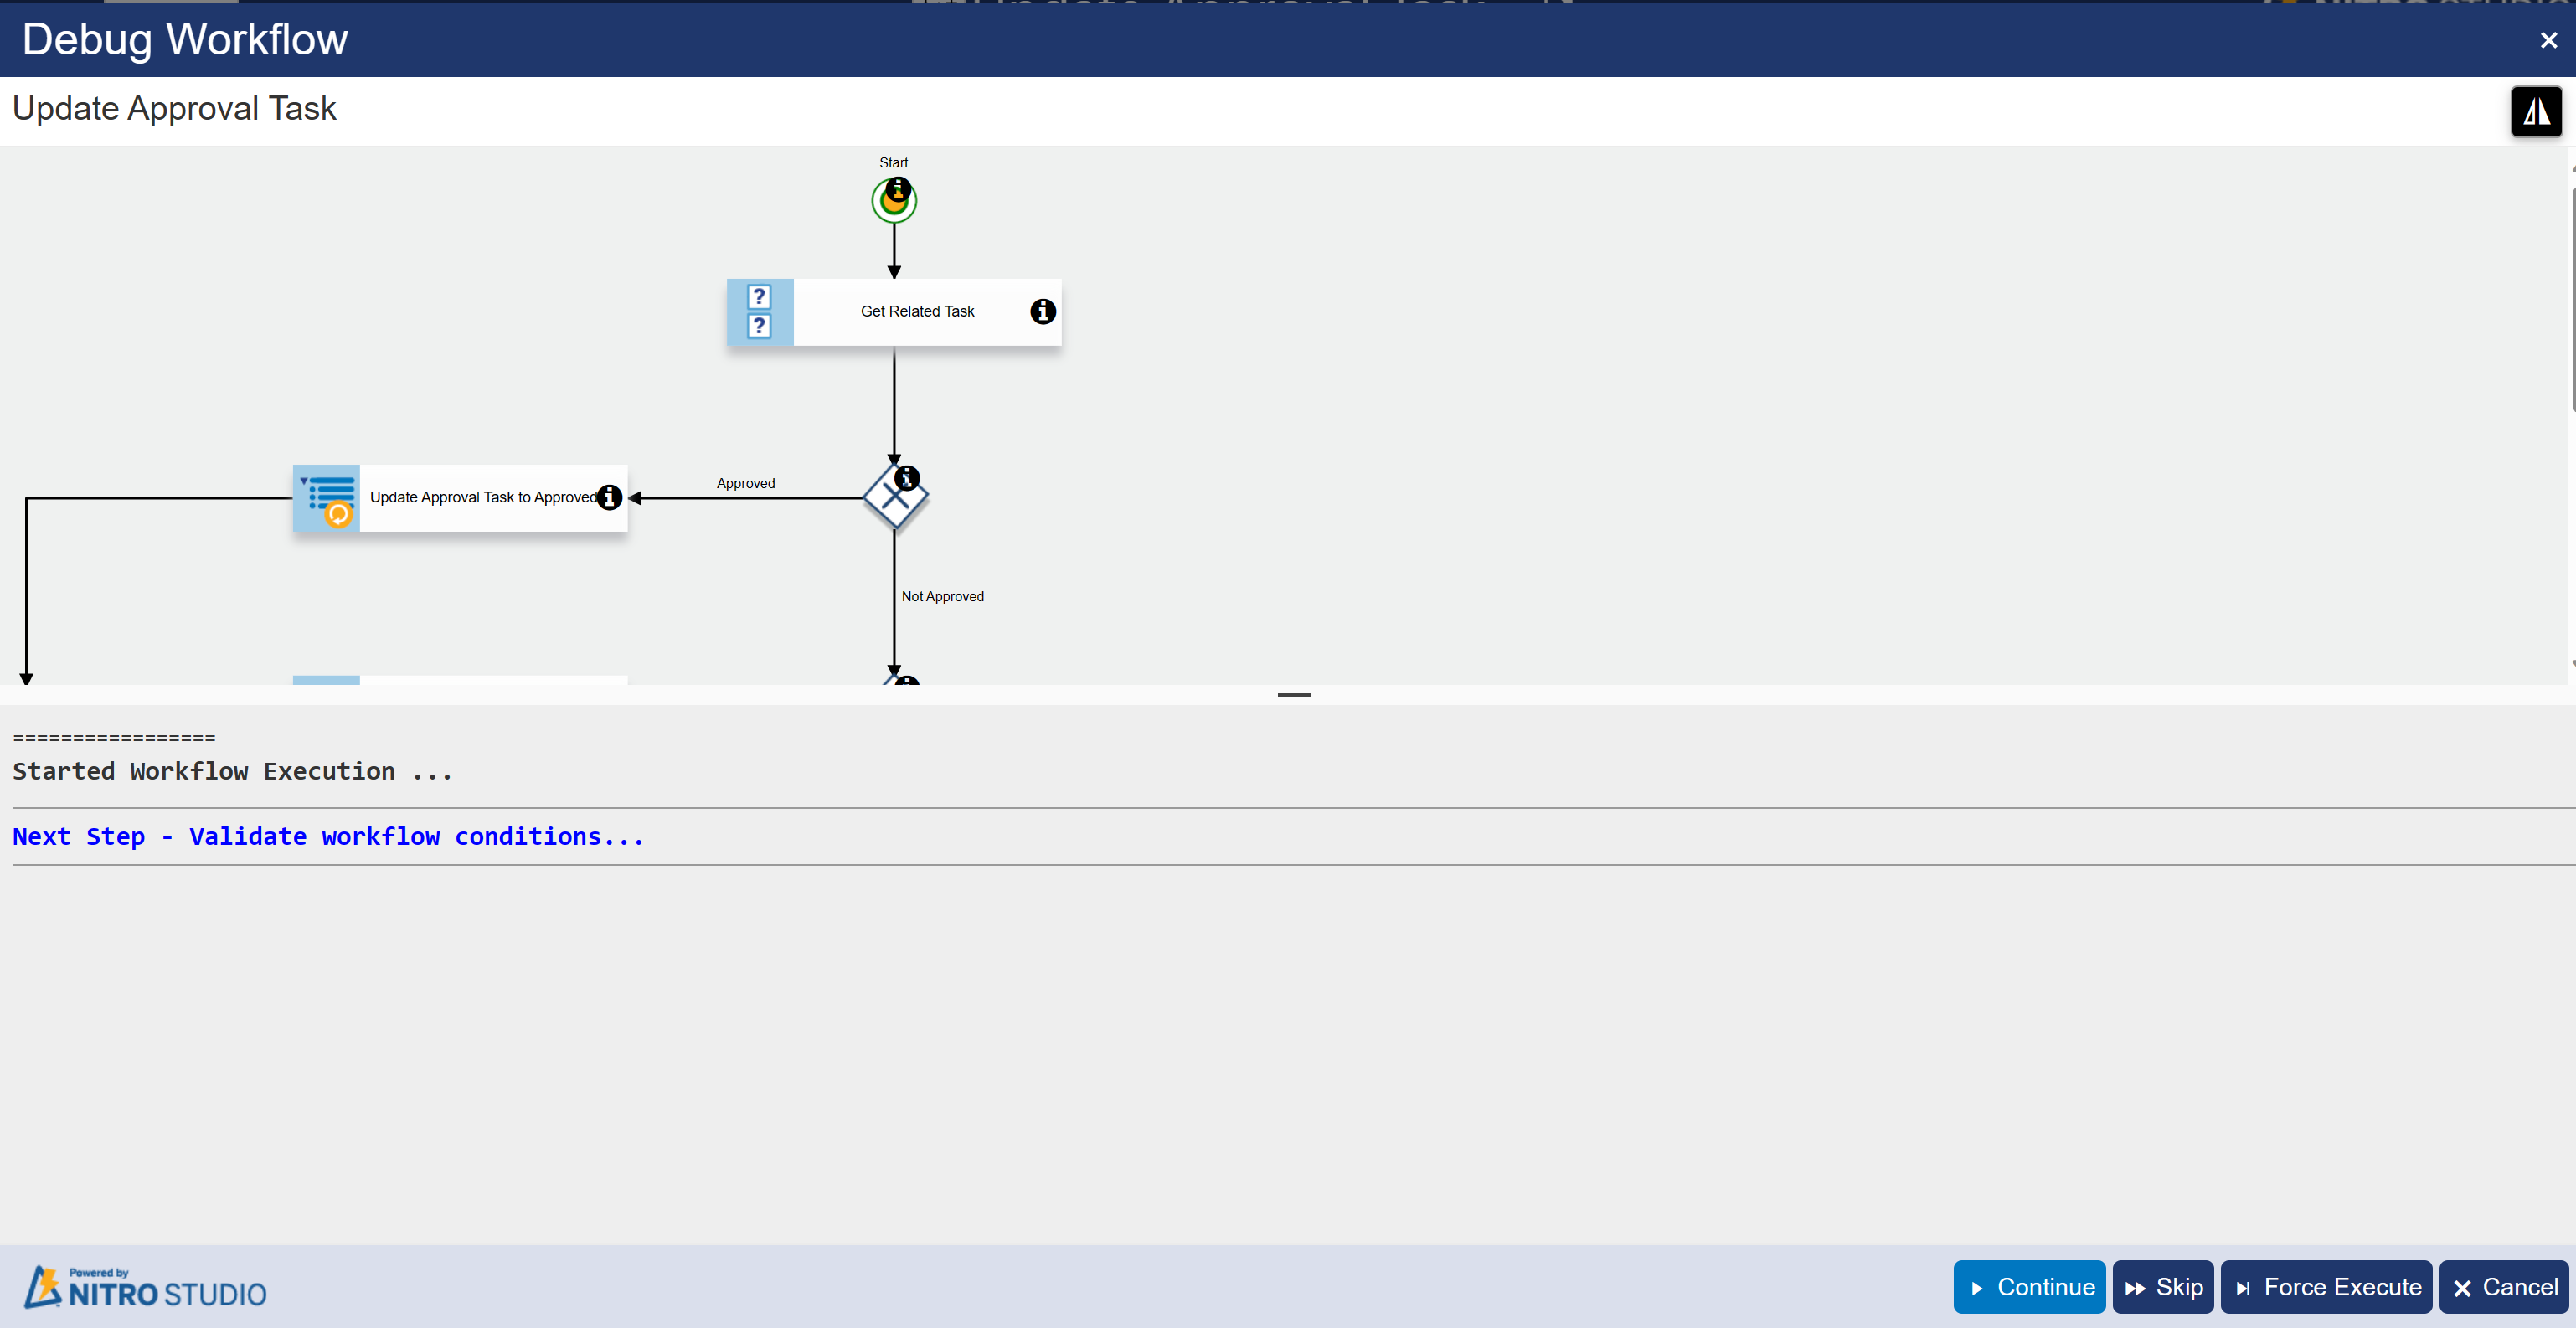
The Debug option will follow your flow from the Start node to the End node so you can see which branches the flow is taking in correspondence with the matching conditions for the item you select in the Trace Action Execution, as shown below. In other words, to run a specific flow of the workflow, the item you select must meet the conditions in each Gateway of the flow.
At first when you click the Debug icon, if you have opted to have a confirmation message on your custom action, you will be prompted with this pop-up, and can continue by clicking "Ok". Other functions of the Debugger show, via the text below the visualizer, whether or not permissions are met, what values are added to variables, and if any items are picked up in Query List actions:
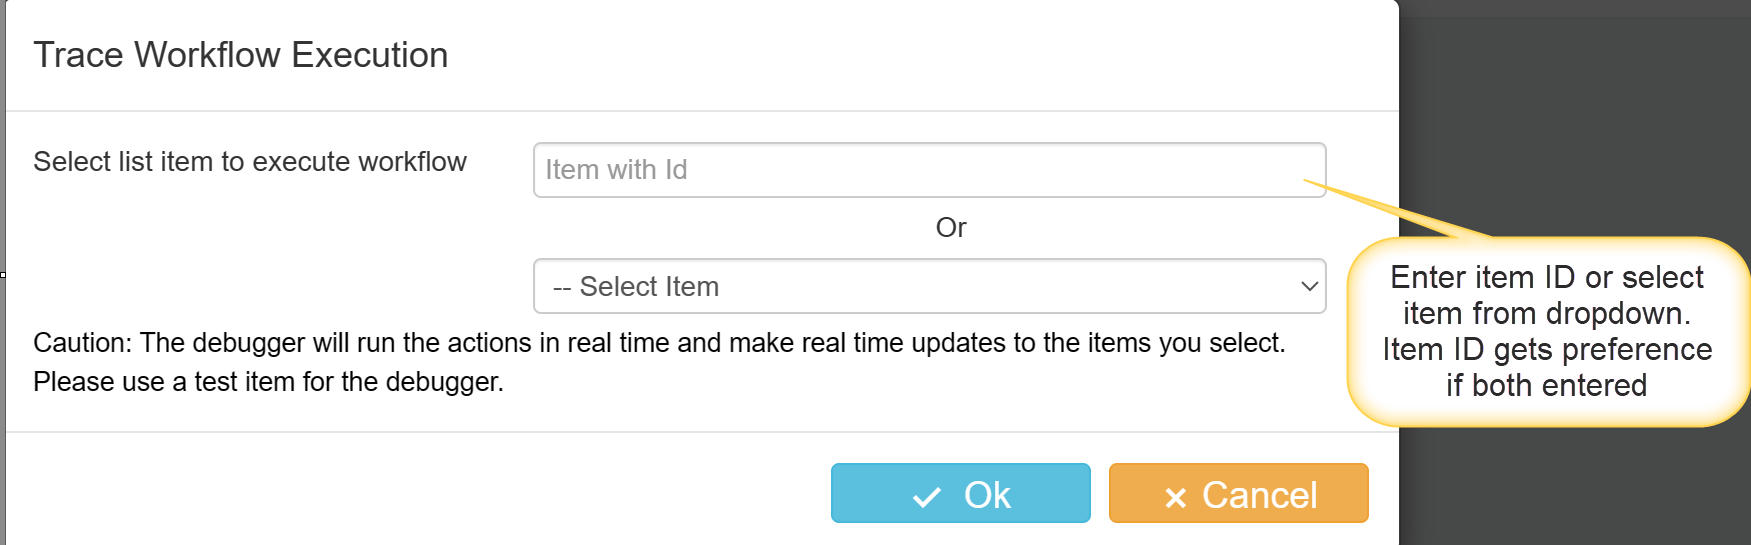
It is important to note that the Debugger will execute the actions that are being tested in the Workflow, so it is a best practice to use test items and be aware of this.
Debugger Controls
Continue - Continue to next step.
Skip - Continue and skip over next step.
Force Execute - Continue to execute Workflow, regardless of errors found.
Cancel - Cancel debugging mechanism