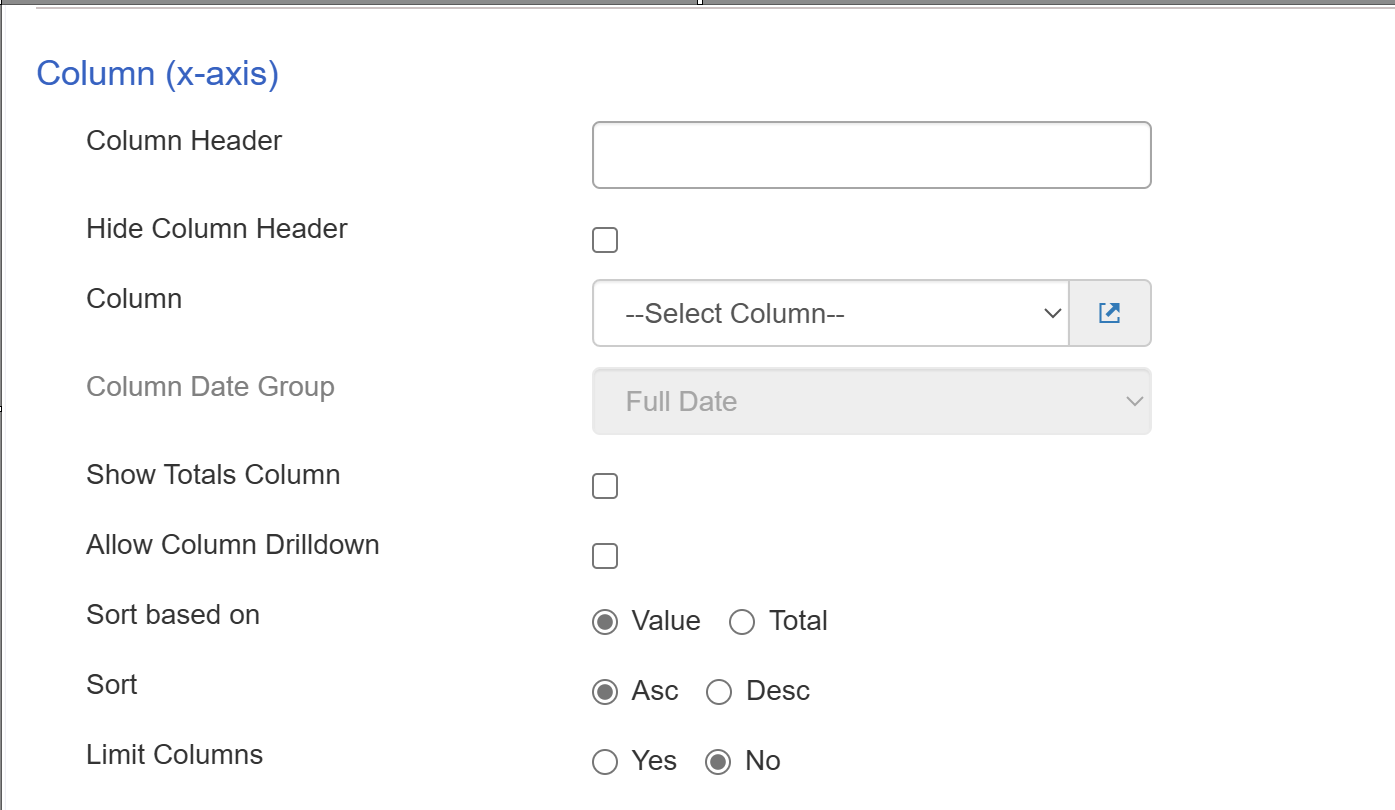
The Column field is the initial list column being represented in the report. This column will be represented as the x-axis, y-axis, column, row or other aspect of the report structure, depending on which report variation you have selected (table, bar, column, pie, etc.).
The Column Date Group setting will allow the column to be grouped by different intervals of time other than the default time interval which is the full date. The column date group will only be enabled if the column selected is a date column.
In a table report, the Show Totals Column setting will calculate the sums of the items within each column.
The Allow Column Drilldown setting will create a feature of the report, that when each column of the table or chart is selected, will open the list view with the filter of only those items that are within the column, in SharePoint list view.
The Sort Based On setting will either enable the Sort setting to sort by the value of the column, or the total, which refers to the total count of the items within that column.
The Sort setting will sort the columns in ascending or descending order either numerically or alphabetically, depending on the type of column.
The Limit Columns setting will limit the number of columns on the chart or table that will be shown.