|
<< Click to Display Table of Contents >> Cell Value |
  
|
|
<< Click to Display Table of Contents >> Cell Value |
|
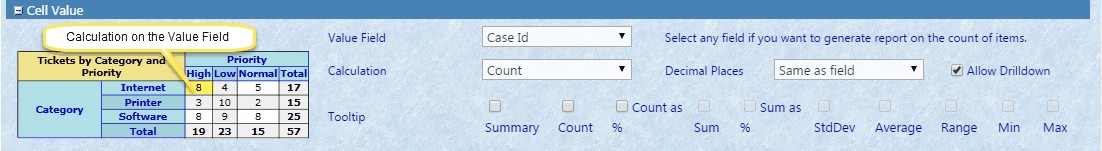
The Value Field determines which field from the list to use for calculating the number of tickets. In many cases, ID will work, as this will provide a count of the total number of tickets that match the criteria.
The Calculation options are Summary, Count, and Count as %
The Tooltip section allows you to pick a type of value to display when you hover over the data in the chart or table.
Summary – Displays all items that meet the row/column intersection criteria
Count – Displays a simple numeric count of the items that meet the row/column intersection criteria
Count as % – Displays the Count value as a percentage of the total number of items returned in the query
Sum – Displays a sum of the values of the items that meet the row/column intersection criteria
Sum as % – Displays a sum of the values as a percentage of the total sum for all values for all items returned in the query
StdDev – Displays the standard deviation for
Average – Displays the average
Range – Displays the distance between the highest and lowest values that meet the row/column intersection criteria
Min – Displays the lowest value that meets the row/column intersection criteria
Max – Displays the highest value that meets the row/column intersection criteria
Decimal Places determines the number of places to show after a decimal point.
The Allow Drilldown checkbox allows for clicking any of the row names to bring up a filtered list view of the items matching that row name.